What Is a Risk Diagram
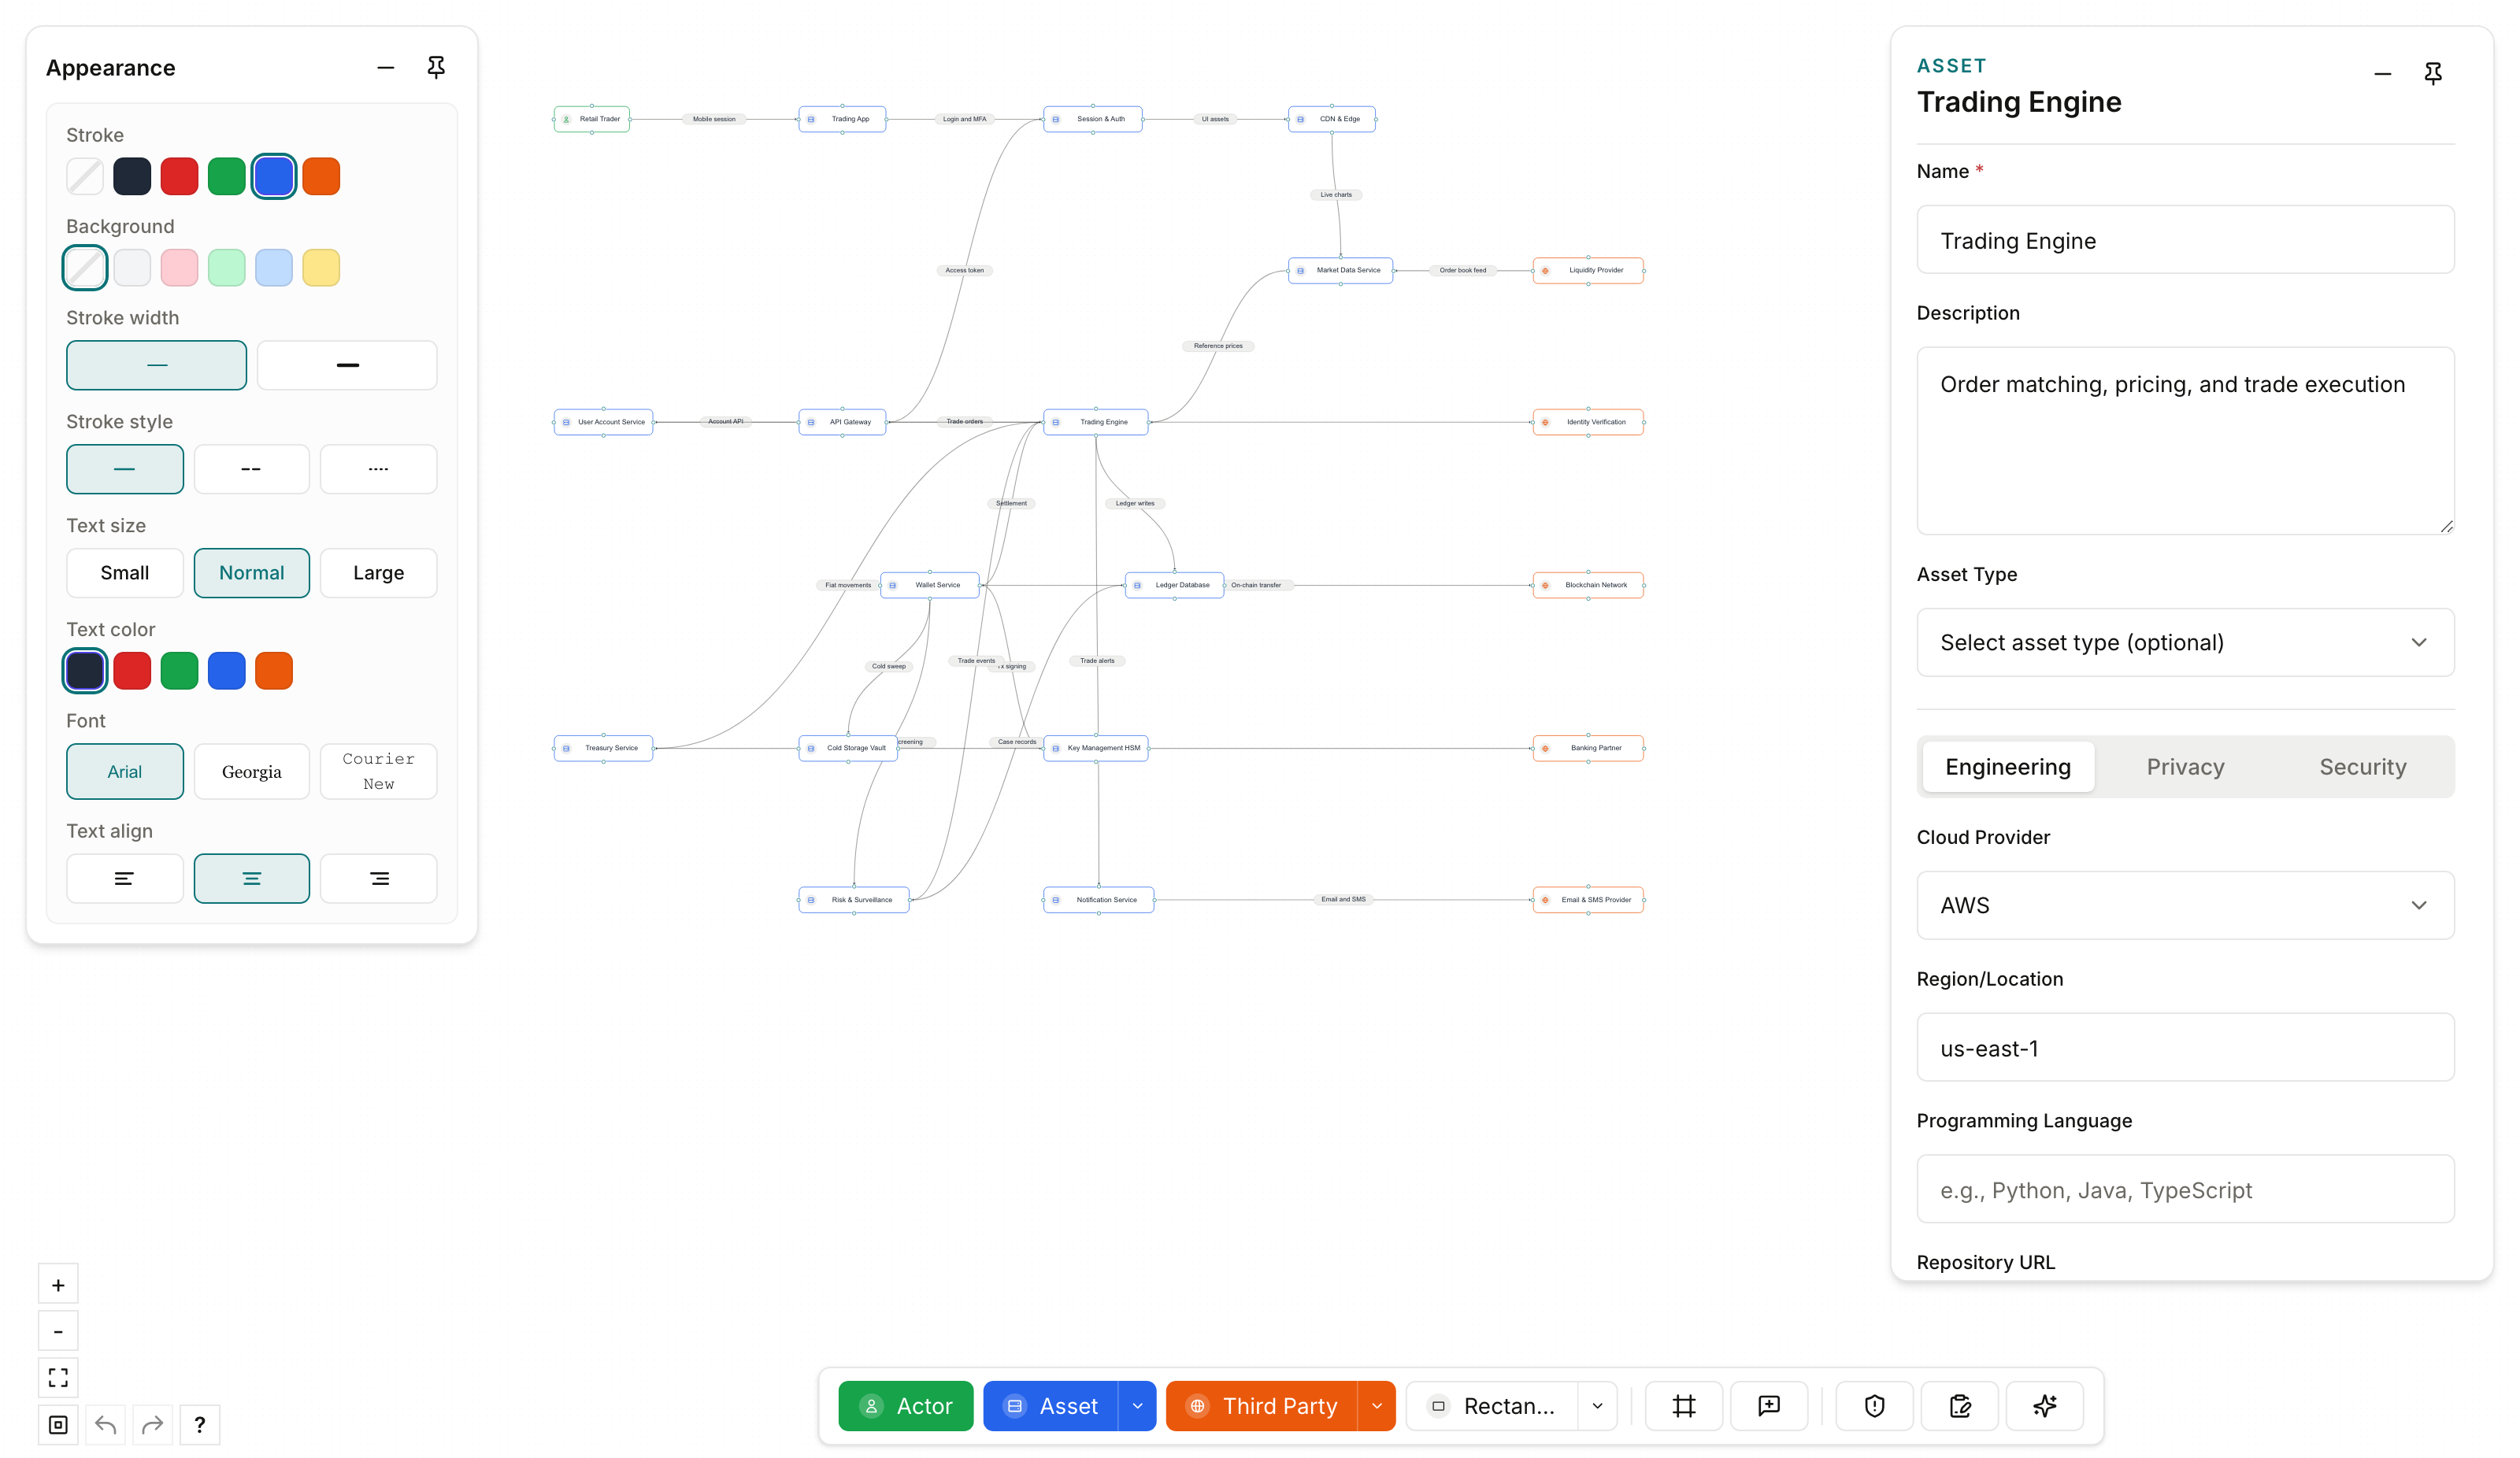
A risk diagram in DataParade models how data moves across systems and actors, and captures privacy and security context directly on each node and flow.
Core Layers
- Layer 1: Global entities (
assets,actors,third_parties) - Layer 2: Per-diagram contextual properties
- Layer 3: Visual nodes and flows on the canvas
Property Tiers
- Canonical: User-authored baseline values
- Scoped: Context-specific values in a diagram
- Derived: Calculated from graph relationships
- Computed: Inferred values that users can override
Teams can also discuss a diagram on the canvas with comments, @mentions, and notifications without changing the underlying model.
To start modeling, follow the Quick Start, or bootstrap from Creation and Imports (templates, JSON import, or CLI scan).
Last updated on